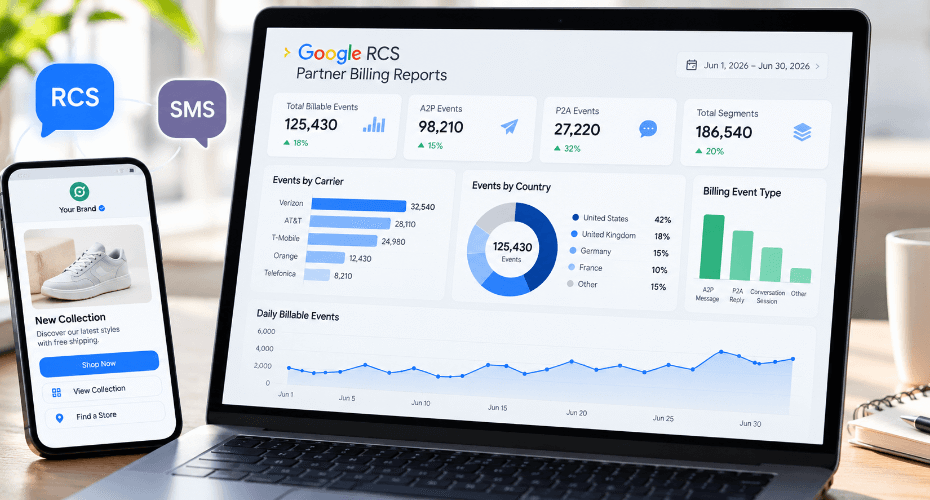
RCS business messaging gives brands richer customer experiences than traditional SMS, but it also creates a more complex reporting environment. Messages can include rich cards, suggested replies, conversations, files, and interactive actions. So businesses need better visibility into how traffic moves across carriers and how billing events are recorded.
Google’s RCS for Business partner billing reports help solve part of that problem. These reports provide daily aggregated billing data for partners actively operating RCS agents.
However, they are not traditional marketing analytics dashboards. They do not tell you which campaign generated the highest conversion rate or which product card produced the most revenue.
Instead, partner billing reports provide operational and billing visibility. As a result, businesses can use them alongside campaign analytics, CRM data, and conversion tracking to build a more complete picture of RCS performance.
What Are Google RCS Partner Billing Reports?
Google RCS partner billing reports are daily files that summarize billable activity generated by RCS for Business agents.
Google creates the reports in CSV format and makes them available through a secure SFTP service. Traffic is also separated by carrier, allowing partners to understand how messaging activity is distributed across networks.
A Report Can Contain Information Such As:
- Billing event type
- RCS agent ID
- Agent name
- Carrier ID
- Carrier name
- Carrier country
- Event start date
- Billing date
- Number of events
- Segment count where applicable
Therefore, the files act as a structured record of billable messaging activity rather than a customer-level marketing report.
Google also separates reporting responsibilities between partners and carriers. Partners receive aggregated daily summaries, while carriers may receive more detailed billing and activity information depending on their role and market.
Why RCS Billing Data Matters to Businesses
RCS campaigns involve more variables than a standard SMS broadcast. A customer may receive a business-initiated message, reply, continue a conversation, select a suggested response, or receive multiple follow-up messages.
As a result, businesses cannot always estimate costs by simply counting outbound sends.
Google’s billing model distinguishes between billing categories and actual billable events. Therefore, marketers and messaging providers need to understand which activity triggered the cost, not just campaign volume.
For businesses operating at scale, this information can help answer questions such as:
- Which agents generate the most billable activity?
- Which carriers handle the largest share of traffic?
- How does activity vary by country?
- Are conversational programs producing more billing events?
- Do reported events match internal message logs?
- Are costs increasing because of higher traffic or different interaction patterns?
The reports therefore become particularly useful for reconciliation, forecasting, and operational monitoring.
Billing Category and Billing Event Are Different
One of the most important concepts in RCS reporting is the difference between an agent’s billing category and the events that appear in reports.
The billing category describes how the agent operates. Meanwhile, billable events describe the interactions Google records for billing.
Google currently separates agents into two broad billing categories: conversational and non-conversational.
| Billing Concept | What It Means |
|---|---|
| Non-conversational | Generally designed for one-way or limited-interaction messaging |
| Conversational | Designed for multi-turn exchanges between a business and user |
| Billable event | A qualifying interaction recorded for billing |
| A2P | Application-to-person message initiated by the business |
| P2A | Person-to-application interaction initiated by the user |
Therefore, two campaigns with the same number of recipients may produce different billing patterns.
For example, a simple notification campaign may generate straightforward message events. However, a customer-service agent that produces long conversations may generate billing activity based on conversational sessions instead.
Delivery Matters More Than Send Time
Another important analytics detail involves when Google records billable events.
For business-initiated RCS messages, Google generally records the event based on message delivery rather than the moment the business sends it.
This distinction matters because messages may not reach the recipient immediately.
For example, imagine a brand sends an RCS campaign on June 30. A customer’s phone remains offline until July 1, when the message finally arrives.
The related billing activity may therefore appear in July rather than June.
Consequently, businesses should not automatically treat differences between their sending platform and billing report as errors. Instead, finance and messaging teams should account for delivery timing during month-end reconciliation.
Google may continue attempting delivery for an extended period before a message expires, which makes this distinction even more important for delayed deliveries.
What the Daily Summary Report Can Reveal
Partner reports provide aggregated event counts grouped by factors such as agent, billing event type, and carrier.
This structure gives messaging teams several useful analytical dimensions.
Traffic by Agent
A company may operate several RCS agents for different brands, countries, business units, or use cases.
By grouping billing events by agent ID and agent name, teams can compare activity across those programs.
For example, one agent may handle promotional messaging while another manages transactional notifications. As a result, businesses can see which programs drive the most billable activity.
Traffic by Carrier
Reports also identify the carrier associated with the traffic.
This information can help messaging providers monitor carrier distribution and reconcile invoices. Large brands can also see how their RCS audience spreads across supported networks.
Carrier-level information becomes especially valuable when costs, availability, or business rules differ by market.
Traffic by Country
The carrier country field provides another layer of visibility.
International brands can therefore compare RCS activity across markets and identify where adoption or message volume is growing.
However, billing volume alone should not serve as an engagement metric. A country with more billable events may simply have more customers or stronger RCS availability.
Billing Reports Are Not Marketing Performance Reports
Businesses should avoid confusing billing analytics with campaign analytics.
Google’s partner billing reports focus on qualifying messaging events. They do not replace metrics such as:
- Conversion rate
- Click-through rate
- Revenue per recipient
- Product views
- Purchases
- Appointment bookings
- Customer satisfaction
- Campaign ROI
Therefore, a high number of RCS billing events does not automatically mean that a campaign performed well.
For example, a conversational campaign might generate thousands of user replies. That could signal excellent engagement. However, it could also mean customers struggled to understand the initial message and needed additional help.
Businesses need customer and campaign data to understand the difference.
Combine Billing Data With Messaging Analytics
The strongest RCS analytics setup connects several data sources rather than relying on one report.
A business might combine:
- Google partner billing reports for billable-event data.
- Messaging platform logs for delivery and interaction events.
- CRM records for customer profiles and journeys.
- Web analytics for site visits and conversions.
- E-commerce data for purchases and revenue.
- Support systems for conversation outcomes.
Together, these systems create a much more useful picture.
For example, billing data may show that an RCS promotional agent generated 100,000 events during a campaign. Meanwhile, campaign analytics could show 28,000 product interactions and 4,000 purchases.
The business can then compare campaign value with messaging cost rather than viewing either number in isolation.
RCS Conversations Require Different Analytics
RCS also changes what marketers should measure.
SMS campaigns traditionally focus on delivery, clicks, conversions, and opt-outs. RCS can include richer interactions such as suggested replies, product cards, and multi-message conversations.
Therefore, businesses may need additional metrics such as:
- Conversation-start rate
- Response rate
- Messages per conversation
- Assisted conversion rate
- Human escalation rate
- Conversation completion rate
- Cost per resolved conversation
- Revenue per conversation
Google’s billing data can support this analysis by showing the underlying billable activity. However, businesses still need their own event tracking to understand what happened inside the customer journey.
Privacy Is an Important Part of the Reporting Model
Google’s partner summary reports use aggregated information rather than exposing individual customer identities.
This approach makes the reports useful for traffic and billing analysis while reducing the amount of customer-level information contained in the files.
Nevertheless, companies should still treat billing data carefully. RCS reporting forms part of a broader messaging infrastructure, and access should remain limited to employees who need it for billing, analytics, engineering, or operations.
Moreover, businesses should maintain clear retention and data-access policies when combining billing information with customer-level CRM or campaign data.
How Businesses Should Use RCS Billing Reports
The most practical approach is to treat Google’s partner billing reports as an operational data source.
Use them to:
- Reconcile messaging invoices
- Monitor daily billable traffic
- Compare agent activity
- Analyze carrier distribution
- Track country-level messaging growth
- Detect unusual changes in billable events
- Improve messaging cost forecasts
- Validate internal reporting systems
Then, combine those findings with campaign performance metrics.
For example, if billable activity increases 30% while conversions rise only 5%, marketers should investigate whether message frequency, conversational depth, or campaign efficiency changed.
Conversely, if costs remain stable while conversions increase significantly, the RCS strategy may be becoming more efficient.

What Google RCS Billing Reports Mean for Messaging Analytics
Google RCS partner billing reports represent an important step toward more transparent business messaging operations.
They give partners structured daily visibility into billable events across agents, carriers, and countries. As a result, businesses can understand how messaging traffic translates into billing activity and reconcile those events with their own systems.
However, billing reports should never become the only source of performance analysis.
The real value emerges when businesses combine billing data with customer interactions, campaign outcomes, revenue, and operational metrics.
Ultimately, RCS analytics requires a broader view than traditional message counting. Brands need to understand not only how many messages they send but also how conversations develop, what those interactions cost, and whether they create meaningful customer outcomes.